Platform

AI

AI Agents
Sense, decide, and act faster than ever before
AI Visibility
See how your brand shows up in AI search
AI Feedback
Distill what your customers say they want
Amplitude MCP
Insights from the comfort of your favorite AI tool

Insights

Product Analytics
Understand the full user journey
Marketing Analytics
Get the metrics you need with one line of code
Session Replay
Visualize sessions based on events in your product
Heatmaps
Visualize clicks, scrolls, and engagement

Action

Guides and Surveys
Guide your users and collect feedback
Feature Experimentation
Innovate with personalized product experiences
Web Experimentation
Drive conversion with A/B testing powered by data
Feature Management
Build fast, target easily, and learn as you ship
Activation
Unite data across teams

Data

Warehouse-native Amplitude
Unlock insights from your data warehouse
Data Governance
Complete data you can trust
Security & Privacy
Keep your data secure and compliant
Integrations
Connect Amplitude to hundreds of partners
Solutions
Solutions that drive business results
Deliver customer value and drive business outcomes
Amplitude Solutions →

Industry

Financial Services
Personalize the banking experience
B2B
Maximize product adoption
Media
Identify impactful content
Healthcare
Simplify the digital healthcare experience
Ecommerce
Optimize for transactions

Use Case

Acquisition
Get users hooked from day one
Retention
Understand your customers like no one else
Monetization
Turn behavior into business

Team

Product
Fuel faster growth
Data
Make trusted data accessible
Engineering
Ship faster, learn more
Marketing
Build customers for life
Executive
Power decisions, shape the future

Size

Startups
Free analytics tools for startups
Enterprise
Advanced analytics for scaling businesses
Resources

Learn

Blog
Thought leadership from industry experts
Resource Library
Expertise to guide your growth
Compare
See how we stack up against the competition
Glossary
Learn about analytics, product, and technical terms
Explore Hub
Detailed guides on product and web analytics

Connect

Community
Connect with peers in product analytics
Events
Register for live or virtual events
Customers
Discover why customers love Amplitude
Partners
Accelerate business value through our ecosystem

Support & Services

Customer Help Center
All support resources in one place: policies, customer portal, and request forms
Developer Hub
Integrate and instrument Amplitude
Academy & Training
Become an Amplitude pro
Professional Services
Drive business success with expert guidance and support
Product Updates
See what's new from Amplitude

Tools

Benchmarks
Understand how your product compares
Templates
Kickstart your analysis with custom dashboard templates
Tracking Guides
Learn how to track events and metrics with Amplitude
Maturity Model
Learn more about our digital experience maturity model
Pricing
LoginContact salesGet started

AI

AI AgentsAI VisibilityAI FeedbackAmplitude MCP

Insights

Product AnalyticsMarketing AnalyticsSession ReplayHeatmaps

Action

Guides and SurveysFeature ExperimentationWeb ExperimentationFeature ManagementActivation

Data

Warehouse-native AmplitudeData GovernanceSecurity & PrivacyIntegrations
Amplitude Solutions →

Industry

Financial ServicesB2BMediaHealthcareEcommerce

Use Case

AcquisitionRetentionMonetization

Team

ProductDataEngineeringMarketingExecutive

Size

StartupsEnterprise

Learn

BlogResource LibraryCompareGlossaryExplore Hub

Connect

CommunityEventsCustomersPartners

Support & Services

Customer Help CenterDeveloper HubAcademy & TrainingProfessional ServicesProduct Updates

Tools

BenchmarksTemplatesTracking GuidesMaturity Model
LoginSign Up

No Need to Tell Us Twice: Dual Y-Axis Support Now GA

Compare metrics at different scales on the same chart to enhance your data storytelling.
Product

May 8, 2025

4 min read

Ilankir Matungulu

Ilankir Matungulu

Senior Product Manager, Amplitude

A chart of units sold by revenue, with both metrics having their own y-axis to compare them better

This blog post was co-authored by Michelle Lee, group product manager at Amplitude.


We are thrilled to announce a powerful new addition to Amplitude’s digital analytics platform: dual y-axis support for Segmentation charts!

Having a left and a right y-axis on a single chart has been one of our most common customer requests recently, and our implementation came directly from engaging with your feedback. You’re an integral part of our development team, and we’re super excited to launch this customer-loved feature to help you compare and analyze metrics at different scales.

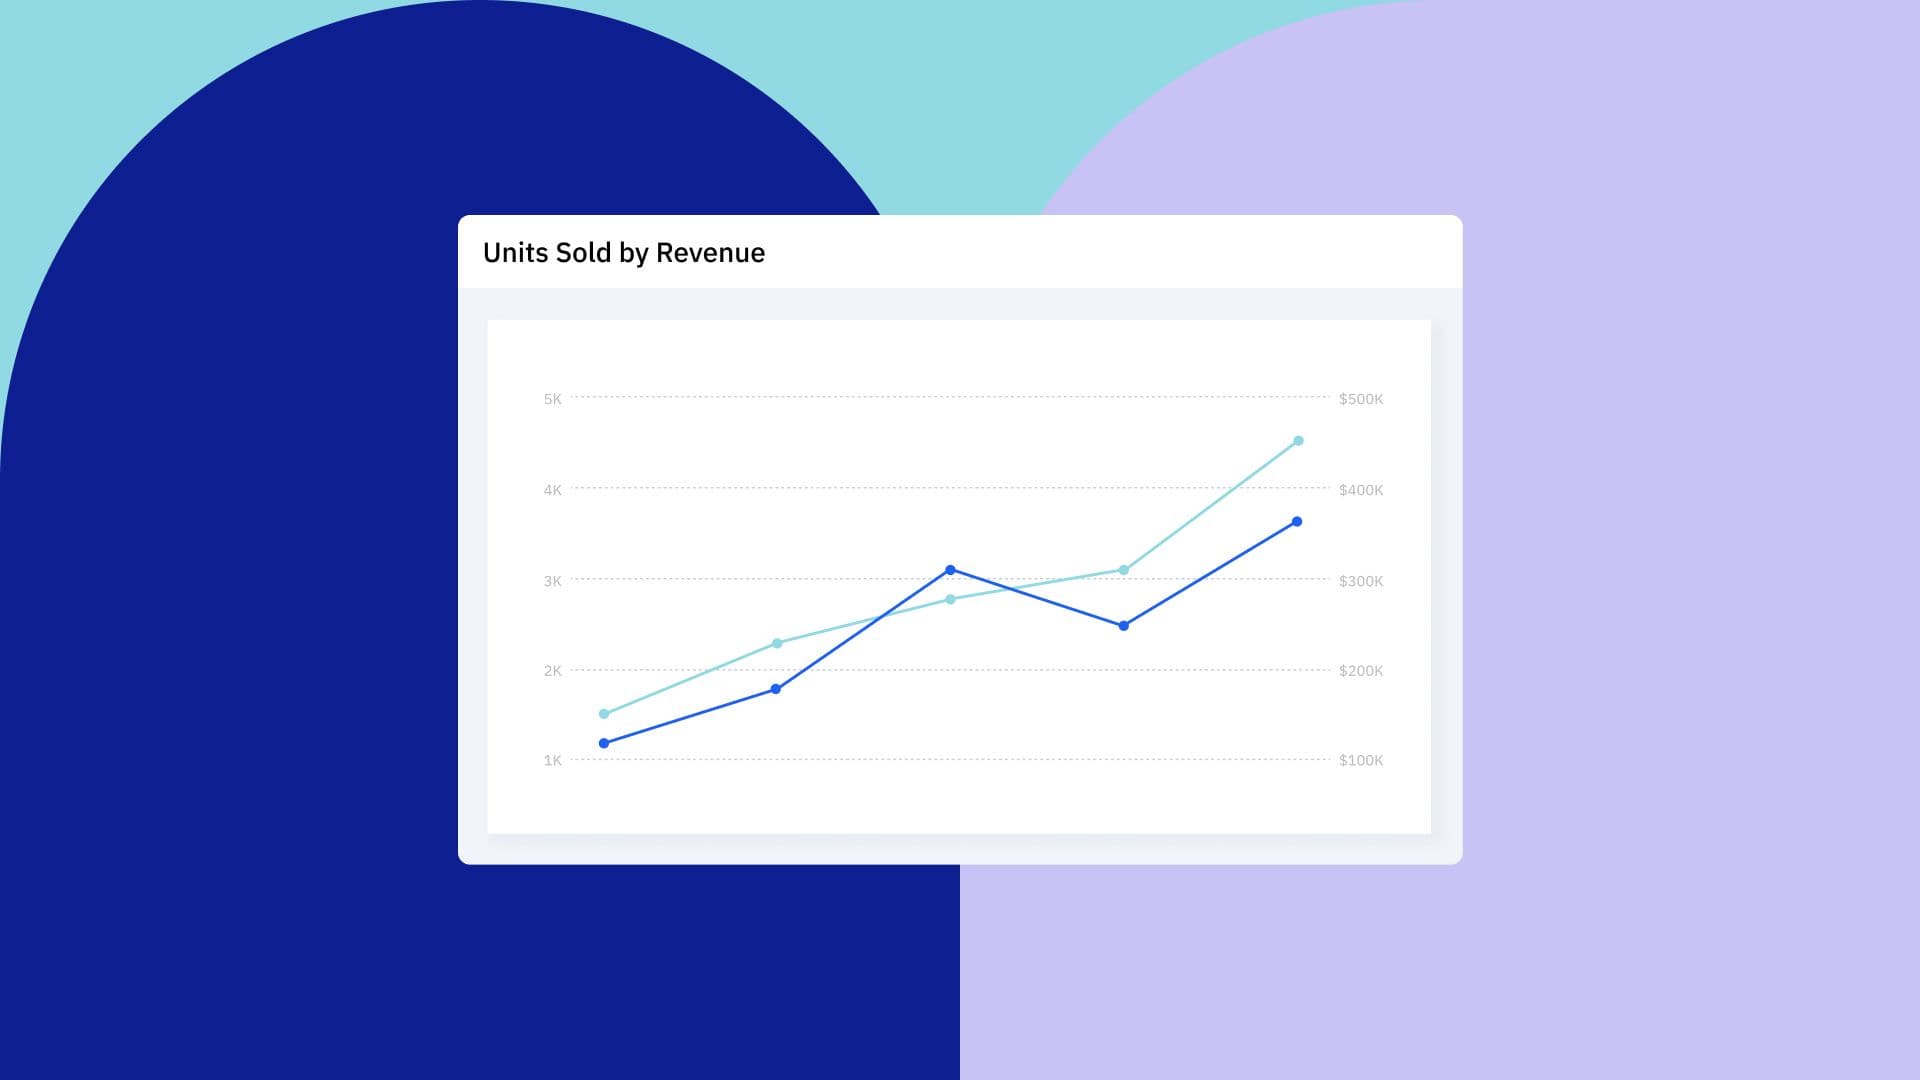
Why would you need two y-axes?

Say you’re comparing two metrics from a recent campaign, like customer acquisition and conversion rates. You want to see if there’s a correlation between them, and the data is over the same timeframe, so it’d make sense to graph both on the same chart, right?

But your acquisition numbers are in the tens of thousands—and your conversion rates are in decimals. Graphing them on the same y-axis would make conversion rate barely a squiggle at the bottom of your chart. You wouldn’t just lose insights into your conversion data—you’d erase the impact of charting these metrics together.

We’ve had workarounds, like adding two Segmentation charts with two different y-axis scales to a single dashboard, but they’ve been cumbersome to set up, tricky to maintain, and haven’t matched your speed of insight. Two separate y-axes would be simpler and faster.

Doubling down on customer feedback

At Amplitude, product improvement starts and ends with customer feedback. Using tools like ProductBoard, we systematically gather, triage, and prioritize requests and insights directly from our user so we can include “customer love” features in our development roadmap along with our other strategic plans.

Dual y-axis support landed high up on the customer love list. Your feedback underscored the challenges you faced with comparing metrics, how manual workarounds didn’t really work, and how a more flexible visualization tool that could handle complex comparative analyses was critical for your analytical efficiency and success.

Thanks to your feedback, this wasn’t a complex comparison: dual y-axis support had a clear need and a clear demand. So we knew we had to prioritize this customer love feature.

What you can do with our new dual y-axis support

Segmentation charts now let you seamlessly compare high-volume and low-volume metrics in a single chart by adding a second y-axis. How it works:

  • Easy axis access: Click on a chart’s default y-axis (on the left) to open a customization panel. Then click Add Right Y-Axis. Now you have two.
  • Independent scaling: Each y-axis auto-populates its minimum and maximum values based on the type of event you’re graphing, not on each other.
  • Clear customization: Change an axis’s title, scale, position, and even unit of measure to fine-tune the data story you’re trying to tell.
A chart of active events vs. new users, with two different y-axes to match each metric's scale

Correlating metrics at any scale makes it easier than ever to see and share the stories in your data. Track new user signups (typically higher-scale) alongside revenue per user (typically a lower scale) to find how acquisition strategies directly correlate with monetization. Or compare feature engagement (hopefully high) to retention rate (a percentage) to understand which user behaviors influence LTV.

By simplifying these comparative analyses, dual y-axis support gets you to data-driven decisions faster.

Two heads (and y-axes) are better than one

Our dual y-axis feature wouldn’t have been possible without your feedback, so thank you to all the customers and community members who gave us input on this (and so many other features too). Amplitude is committed to customer-driven innovation, and your feedback guides every improvement we make on our journey to build the best digital analytics platform.

Dual y-axis support is now available for all customers to use. Explore new correlations by adding another y-axis to your charts—and share the insights you find!

Interested in elevating your feedback? Join the Amplitude Community to connect with us directly—and with other analytics enthusiasts! You can even become a Customer Development Partner to get early access to our new features and help shape them with your input.

About the author
Ilankir Matungulu

Ilankir Matungulu

Senior Product Manager, Amplitude

More from Ilankir

Ilankir is a senior product manager at Amplitude, focused on scaling the core analytics product to meet the performance and security needs of enterprise organizations. Prior to Amplitude, Ilankir was a senior software engineer turned project manager at Schneider Electric, where he built data applications used in power plants across North America, EMEA and Asia.

More from Ilankir
Topics

Analytics

Product Analytics

Marketing Analytics

Metrics

Recommended Reading

article card image
Read 
Product
Getting Started: Product Analytics Isn’t Just for Analysts

Dec 5, 2025

5 min read

article card image
Read 
Insights
Vibe Check Part 3: When Vibe Marketing Goes Off the Rails

Dec 4, 2025

8 min read

article card image
Read 
Customers
How CAFU Tripled Engagement and Boosted Conversions 20%+

Dec 4, 2025

8 min read

article card image
Read 
Customers
The Future is Data-Driven: Introducing the Winners of the Ampy Awards 2025

Dec 2, 2025

6 min read

Platform
  • Product Analytics
  • Feature Experimentation
  • Feature Management
  • Web Analytics
  • Web Experimentation
  • Session Replay
  • Activation
  • Guides and Surveys
  • AI Agents
  • AI Visibility
  • AI Feedback
  • Amplitude MCP
Compare us
  • Adobe
  • Google Analytics
  • Mixpanel
  • Heap
  • Optimizely
  • Fullstory
  • Pendo
Resources
  • Resource Library
  • Blog
  • Product Updates
  • Amp Champs
  • Amplitude Academy
  • Events
  • Glossary
Partners & Support
  • Contact Us
  • Customer Help Center
  • Community
  • Developer Docs
  • Find a Partner
  • Become an affiliate
Company
  • About Us
  • Careers
  • Press & News
  • Investor Relations
  • Diversity, Equity & Inclusion
Terms of ServicePrivacy NoticeAcceptable Use PolicyLegal
EnglishJapanese (日本語)Korean (한국어)Español (Spain)Português (Brasil)Português (Portugal)FrançaisDeutsch
© 2025 Amplitude, Inc. All rights reserved. Amplitude is a registered trademark of Amplitude, Inc.
Blog
InsightsProductCompanyCustomers
Topics

101

AI

APJ

Acquisition

Adobe Analytics

Amplify

Amplitude Academy

Amplitude Activation

Amplitude Analytics

Amplitude Audiences

Amplitude Community

Amplitude Feature Experimentation

Amplitude Guides and Surveys

Amplitude Heatmaps

Amplitude Made Easy

Amplitude Session Replay

Amplitude Web Experimentation

Amplitude on Amplitude

Analytics

B2B SaaS

Behavioral Analytics

Benchmarks

Churn Analysis

Cohort Analysis

Collaboration

Consolidation

Conversion

Customer Experience

Customer Lifetime Value

DEI

Data

Data Governance

Data Management

Data Tables

Digital Experience Maturity

Digital Native

Digital Transformer

EMEA

Ecommerce

Employee Resource Group

Engagement

Event Tracking

Experimentation

Feature Adoption

Financial Services

Funnel Analysis

Getting Started

Google Analytics

Growth

Healthcare

How I Amplitude

Implementation

Integration

LATAM

Life at Amplitude

MCP

Machine Learning

Marketing Analytics

Media and Entertainment

Metrics

Modern Data Series

Monetization

Next Gen Builders

North Star Metric

Partnerships

Personalization

Pioneer Awards

Privacy

Product 50

Product Analytics

Product Design

Product Management

Product Releases

Product Strategy

Product-Led Growth

Recap

Retention

Startup

Tech Stack

The Ampys

Warehouse-native Amplitude