Attrition & Retention Analytics to Increase Repeat Buyers
Explore the essential retention and attrition metrics, learn how to analyze them, and what you need to do to improve your churn rate.

Customer retention is a critical metric for any company. A high customer retention rate means that more customers find value in your product and will stick around with you for the long term.
Conversely, a low retention rate can be a sign that users are quickly losing interest in your products and might be leaving soon.
To encourage customers to stay, it’s important to understand your attrition and retention analytics, as they help you determine what’s influencing customer loyalty. Fortunately, it’s never been easier to optimize your retention metrics — providing you have the right tools and process.
Key takeaways
- Move past the standard retention graph and engage users at each stage of their lifecycle.
- Use KPIs like N-Day retention, unbounded retention, and bracketed retention to get a more accurate picture of customer loyalty.
- Determine your critical events and product usage level to set up your attrition and retention analysis.
- Benchmark your retention against your cohort data for the most relevant results.
- Use tried and tested frameworks to create and prioritize your experiment goals.
The gap between attrition (churn) & retention
Attrition, or churn, measures the number of customers who stop using a product subscription or service within a given period. Several factors can cause attrition, including poor customer service, high prices, and changes in your customer’s needs or circumstances.
Retention is the opposite of attrition. It’s the process of keeping existing customers satisfied and preventing them from leaving. Retaining a user costs far less than acquiring a new one, so minimizing the gap between the two is essential.
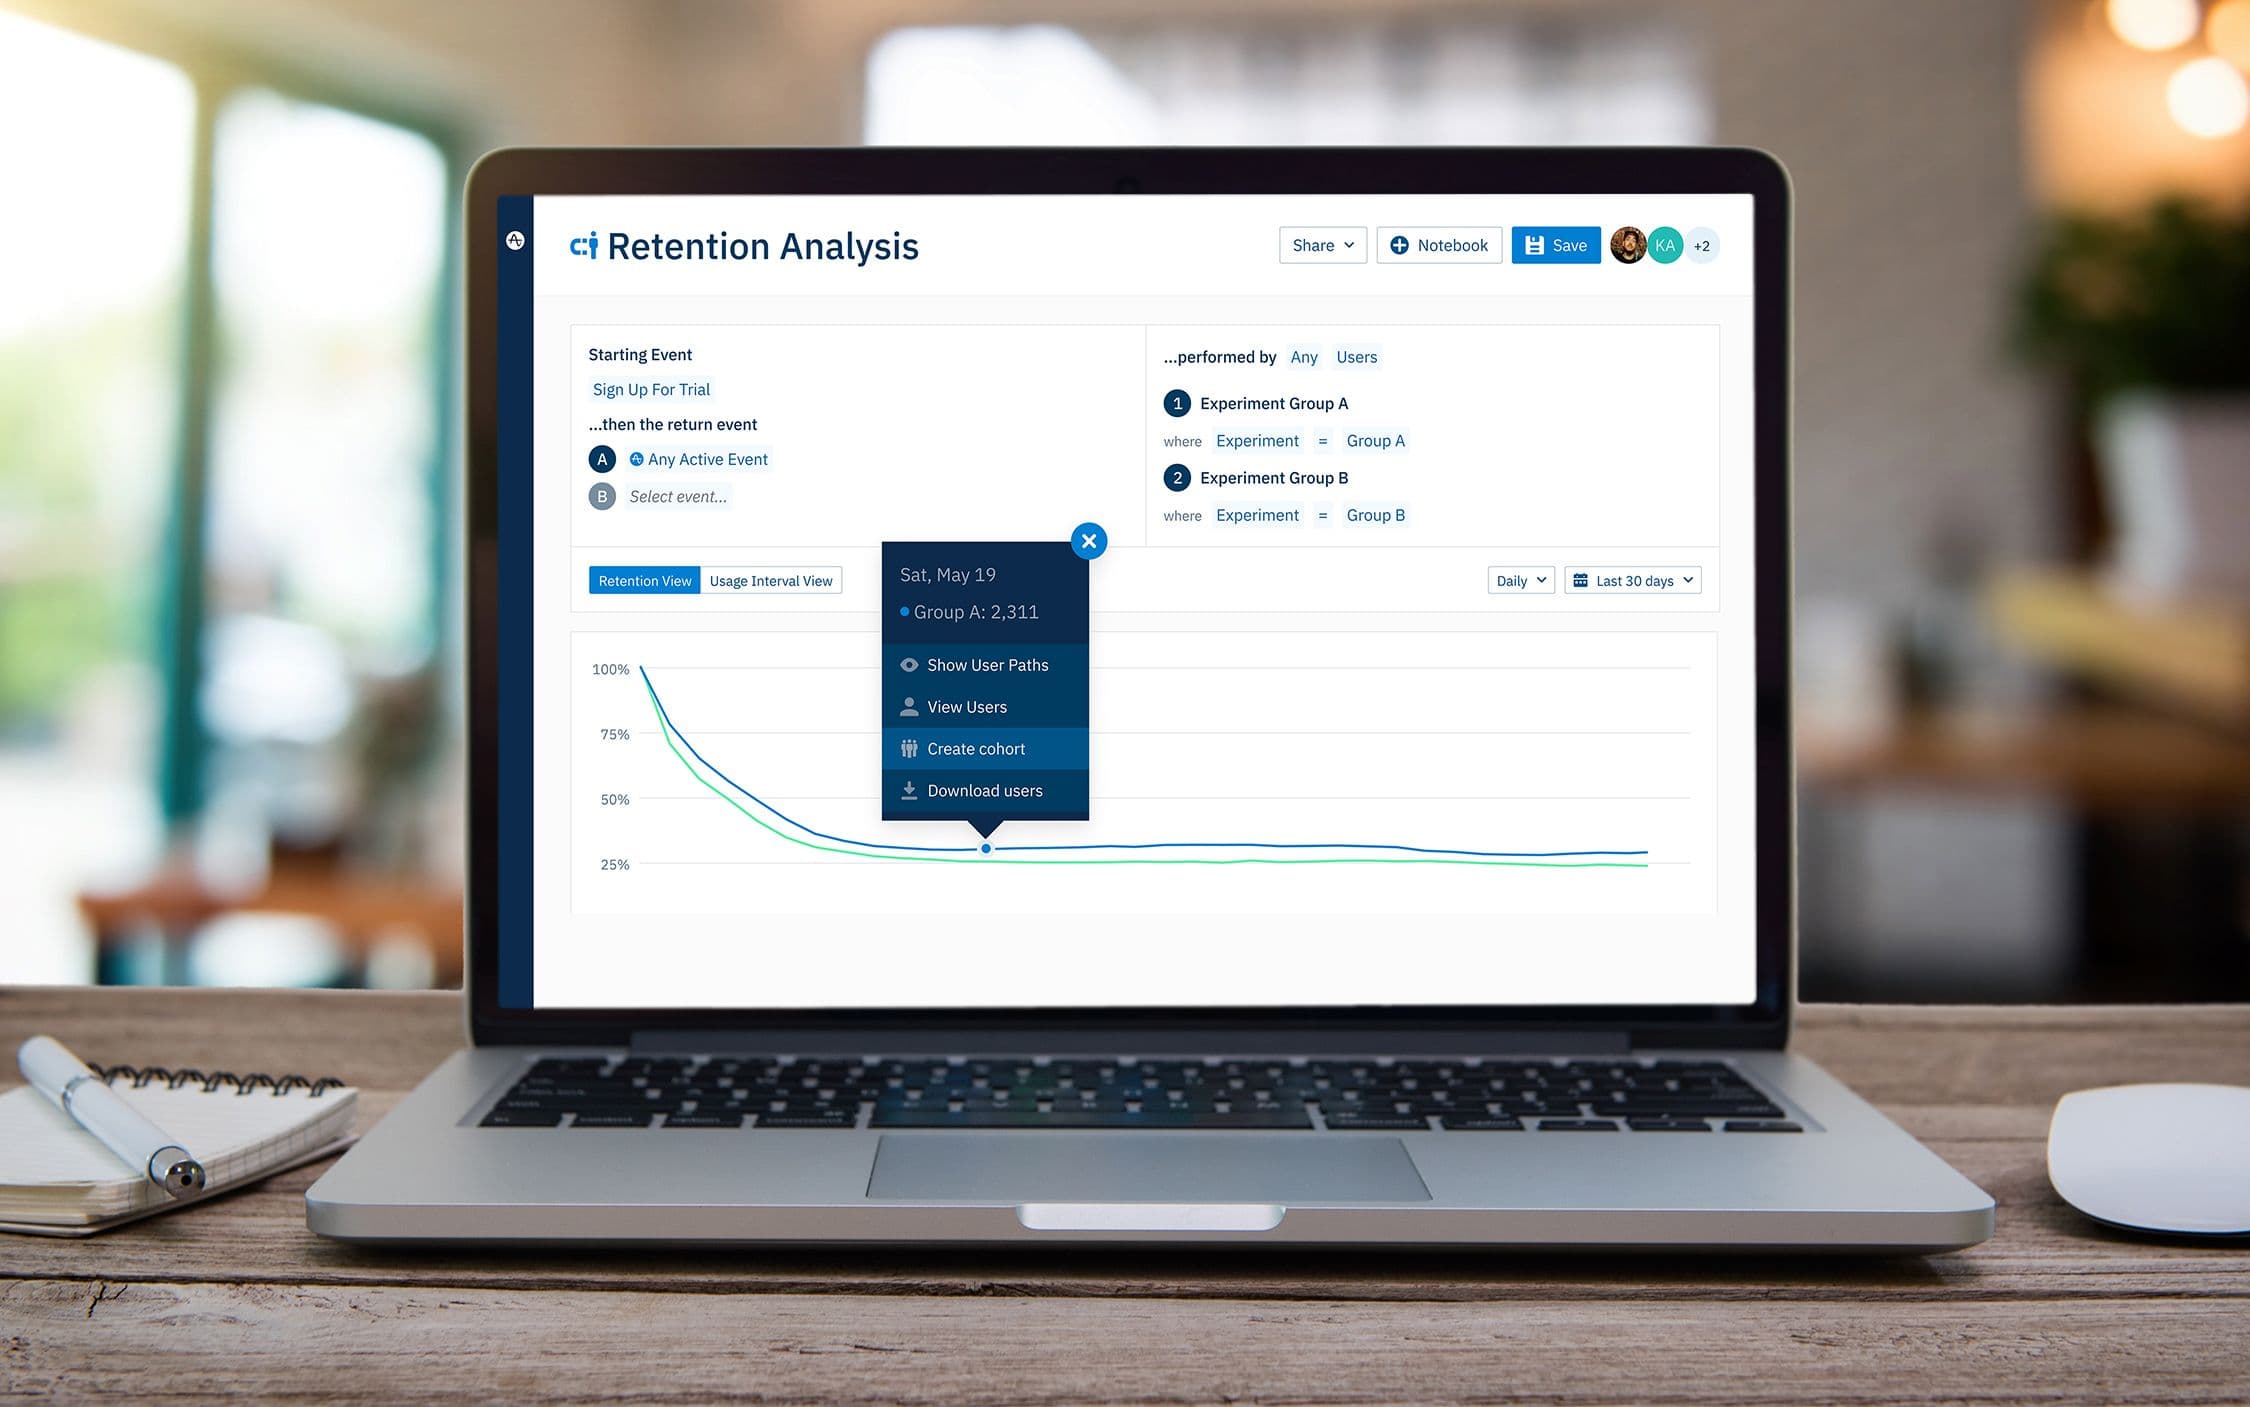
You’re likely accustomed to seeing a typical retention curve, which charts the number of days on the X-axis (usually percentage) and the proportion of active users on the Y-axis.
The issue with this retention curve is that it combines many distinct kinds of users into one curve. In reality, not all users are created equal.
Active users go through three different stages of retention:
- New users: users who are new to your product.
- Current users: users who have been engaging with your product for any length of time.
- Resurrected users: users who previously used your product and then became inactive for a while before resuming usage.
Some dormant users have fallen off the radar and no longer use your product. At this point, these customers are considered churned.
You need to interact differently with new and present users, create plans to bring back dormant users, and encourage each user segment to be active and engage more with your product.
Learn more about this Retention Lifecycle Framework as part of our free Mastering Retention Playbook, which dissects how you can engage your users at each stage of retention to achieve industry-leading rates.
Retention vs. attrition: essential KPIs you should be tracking
Your most impactful metrics for user retention are your critical events and your product usage interval; however, we’ll cover these in more detail in the next section. For now, let’s get a solid grasp on churn rate and retention rate.
Churn rate
Customer churn rate is the percentage of customers who stop doing business with you over a specific period. It’s the inverse of the customer retention rate.
Churn rate is vital because it helps you understand how effectively you can retain customers. If your churn rate is high, you need to figure out why customers are leaving.
The formula to calculate customer churn rate is [Y/X] × 100, where Y is the number of customers lost during that period and X is the number of customers at the start of the period. For example, if you start the month of January with 400 customers and by the end of the month, you’ve lost 60 customers, your customer churn rate would be 15%. Here’s this example churn rate as a formula:
60/400 × 100 = 15%
The churn rate is often used interchangeably with the attrition rate — which is further categorized as voluntary and involuntary attrition.
Voluntary attrition is attrition that’s under the customer’s control. For example, if a customer cancels their subscription or service because they’re moving to a competitor’s product, that would be considered voluntary attrition.
Involuntary attrition is attrition that’s out of the customer’s control. If a customer’s credit card expires and they don’t update their billing information, which cancels their subscription, that would be involuntary attrition.
You’re probably wondering: what is an acceptable churn rate?
B2B companies typically reach average churn rates of around 5% compared with the 7.05% that’s more typical for B2C companies. And that’s just the tip of the iceberg on industry rates.
Research reveals that rates vary significantly within seemingly similar industries. SaaS industry averages, for instance, are at just 4.79%, while business services generally garner much higher rates of 6.25%.
Even customer-forward companies in the media and entertainment industry are down to 4.67%, compared with a significantly higher 9.62% churn rate from consumer goods businesses.
Retention rate
Customer retention rate is the percentage of customers who stay with your company over a specific period.
Customers can be retained in different ways, such as by continuing to use your product or service or by spending more money with your business.
The formula for retention rate is (X-Y) ÷ Z × 100, where X is the number of customers at the end of the period, Y is the number of new customers acquired, and Z is the number of customers at the beginning of the period.
So if you start the month of January with 575 customers and by the end of the month, you’ve acquired 20 new customers by the end of the month, you have 550 customers, your retention rate would be:
(550-20) ÷ 575 × 100 = 92.17%
Customer retention rate is an important metric, but it’s only the beginning of retention KPIs.
At Amplitude, we measure retention by N-Day retention, unbounded retention, and bracket retention.
N-Day retention
N-Day retention measures retention on a set day, looking at how many users performed a specific action on day 1, day 7, and so forth. In the graph below, 4.96% of users come back on day 14.
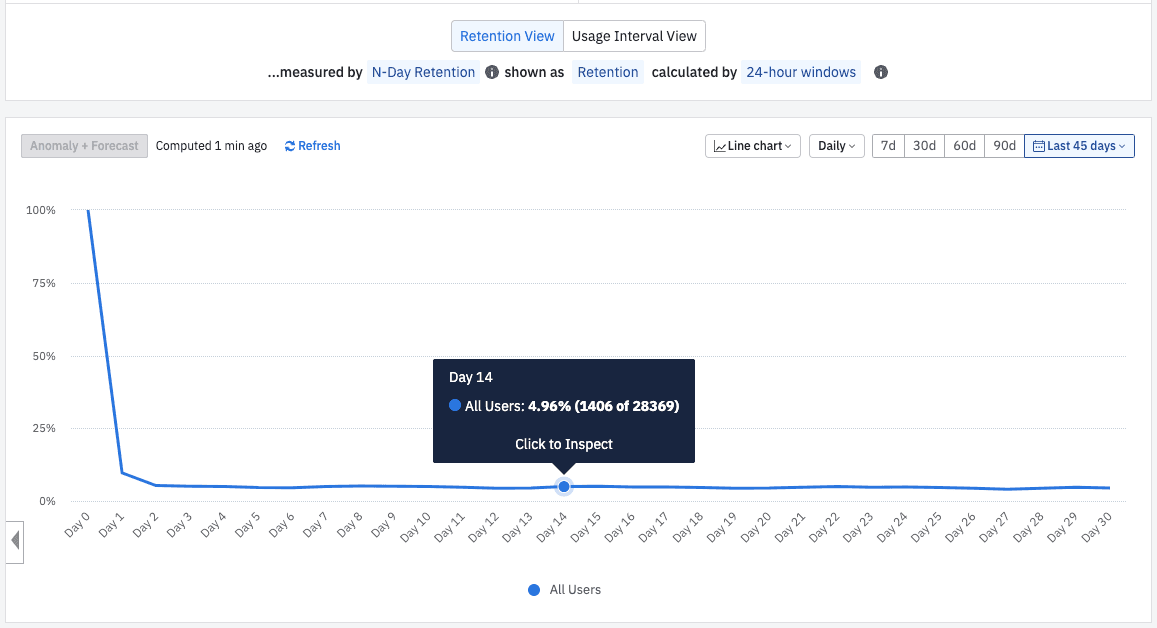
See an example chart using data from our mock E-Commerce Amplitude instance called AmpliCart.
N-Day retention is ideal for mobile games or social media apps, as well as any other kind of product that requires regular, consistent behavior from users.
Unbounded retention
Unbounded retention calculates the percentage of users who return to a product or service on a specific day or any day after that. Below, ~20% of users come back on day 1 or later. This number reflects the percentage of users who come back on day 1 or any time after day 1.
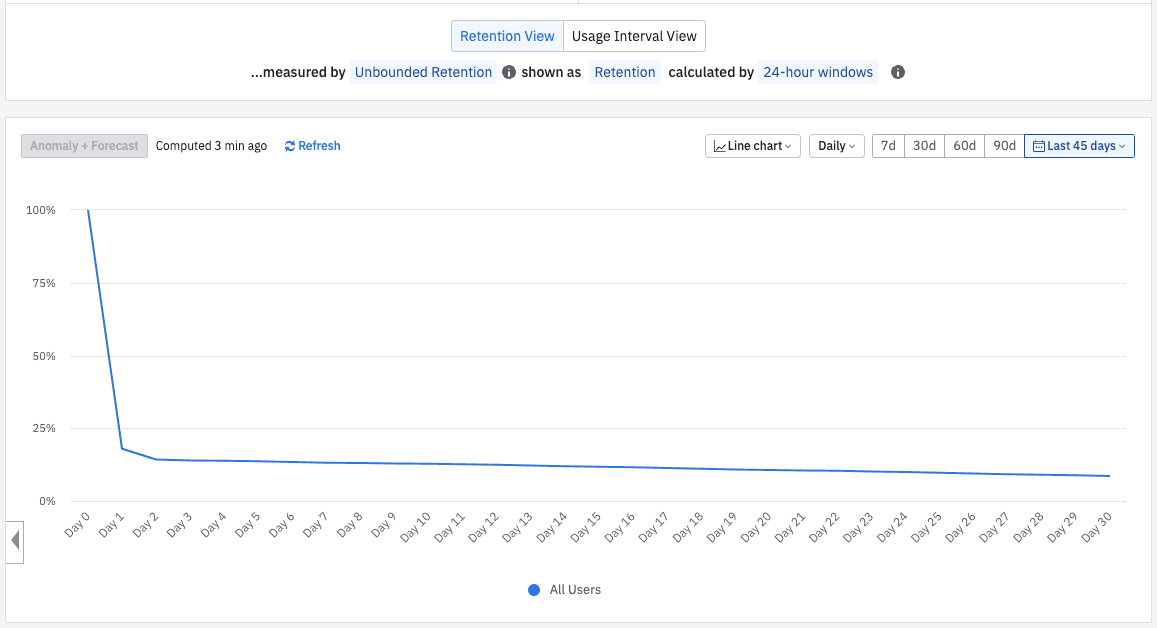
See an example chart using data from our mock E-Commerce Amplitude instance called AmpliCart.
This type of analysis can be more accurate than N-Day retention for businesses that don’t have a regular cadence of users returning.
Bracket retention
Bracket retention is a more nuanced way of analyzing customer retention. It involves looking at user behavior over a custom period instead of a fixed timeframe.
For example, you could set the first bracket as day 0 and the second as days 1-3. Amplitude will measure what percentage of users return during each time bracket, as seen in the image below.
How to analyze retention and attrition metrics
Sending optimal event data to your analytics platform is the most important step in understanding how customers engage with your product. Below is our recommended process to ensure your instrumentation is set up for success.
Step #1: Check your analytics instrumentation
The first step in any retention or attrition analysis is establishing you have the suitable instrumentation. This means tracking the events that matter most to your business and ensuring they’re captured accurately.
Say you want to capture how often users return to your app after signing up. To do this, you must follow both the “sign up” and the “app launch” events. If you’re not tracking one of these events, you won’t be able to measure retention accurately.
To get started, look at your event tracking and ensure you capture all the key events you need for your analysis. You can collect this data through an analytics platform like Amplitude, Heap, or Mixpanel.
Lastly, validate your data by checking your onboarding and critical paths and doing rigorous error testing.
Step #2: Organize your event taxonomy
Once you’ve verified you’re tracking all the right events, the next step is to set up your taxonomies. A taxonomy is a way of classifying events to be easily analyzed.
For instance, you might want to create a taxonomy with two event types: “user events” and “product events.”
User events would include events such as signing up, logging in, and updating the profile. Product events would consist of events such as viewing the product, adding it to the card, and purchasing the product. Organizing your events into a taxonomy will make it easier to analyze them later on.
Step #3: Determine your critical events
A critical event is an action your customers take inside your product that strongly supports your company’s value proposition.
If you’re trying to increase retention, one of your critical events might be making the purchase, which you labeled as “purchase.” This is because users who purchase are more likely to return and use your product again.
But if you’re trying to decrease attrition, one of your critical events might be logging in to the product which you labeled as “login.” This is because users who log in are more likely to stick around and use your product.
Step #4: Determine your product usage interval
The final step is to determine your product usage interval, which is the timeframe you want to use for your retention analysis.
For example, some products, such as messaging apps, are created to be used daily and their usage interval would be one day. Attrition would be defined as a user not using the product for one day.
Other services, such as ecommerce stores, might have a usage interval of one week or one month — and attrition would be defined as a user not using the platform for that period.
Applying attrition & retention analytics to improve your churn rate
Now that you have a framework for analyzing attrition and retention analytics, it’s time to implement it. Execution comes down to benchmarking, setting goals, and prioritizing your experiments.
Benchmark your retention
Cohort analysis and event-based analysis are two of the most commonly used methods for benchmarking customer engagement.
Cohort analysis entails grouping users based on common characteristics or behaviors, then tracking engagement metrics over time. For instance, a cohort might be defined as all users who sign up for a website in a given month.
Monitoring how active these users are over several months or years makes it possible to benchmark attrition and retention rates.
Event-based analysis focuses on specific events or actions that users take within a product or service. For example, an event might be defined as adding an item to a shopping cart, completing a purchase, or reading a particular blog post.
By tracking how often and quickly users complete certain events, it’s possible to measure the engagement and assess which product areas are used most frequently. Each approach has its advantages and disadvantages.
Cohort analysis is excellent for measuring long-term trends, but it can be challenging to isolate the impact of individual events. Event-based analysis provides more granular insights but doesn’t always paint a clear picture of how users interact with a product over time. The best approach is to use both methods in tandem, as they complement each other nicely.
Set your retention goals
We recommend using a goal-setting system called OKRs (Objectives and Key Results). OKRs was invented by Intel’s co-founder, Andrew Grove, and popularized by Google — providing a clear framework for setting and achieving goals.
The first step is to state your overall retention goals. Next, you need to set a timeframe (30 to 90 days) and identify three key results you want to achieve. Each of these results should be something measurable. For example, you might want to improve retention by 20%, 2x, or 10x. Once you have your results, brainstorm the actionable objectives that you’ll use to hit those targets.
It sometimes helps to write the OKR framework as a sentence so it’s clear and actionable. For example, “In the next 30 days, we want to increase our cohort retention by 20%.”
Prioritize your experiments
Now that you have your retention goals, it’s time to start running experiments to hit those targets. But with so many possible experiments, how do you know which ones to prioritize?
There’s no point in reinventing the wheel. So we suggest using the ICE framework popularized by Brian Balfour and Sean Ellis. I-C-E helps you prioritize experiments based on their impact, confidence, and ease of implementation:
- Impact: How big of an impact will this experiment have on our retention rate?
- Confidence: How confident are we that this experiment will improve our retention rate?
- Ease: How easy is it to implement this experiment?
To prioritize your experiments, start by brainstorming a list of potential tests. Then, score each experiment on a scale of 1 to 10 for each element. The higher the score, the more critical it is to run the experiment.
| Idea Backlog | Impact | Confidence | Ease |
| Create credit card expiry email reminder automation | 8 | 6 | 4 |
| Add onboarding step encouraging users to create first task | 9 | 8 | 7 |
| Enable social logins | 6 | 5 | 5 |
Prioritize your experiments by order of importance (I × C × E).
After you’ve run your experiments, schedule weekly or biweekly check-ins with your team. Review your attrition and retention rates during these check-ins and discuss any changes you’ve made to your experiments.
Maintain records of your progress to see how well your retention strategy works. If you’re not making the progress you want, don’t be afraid to pivot and try something new. Keep iterating and experimenting until you find a retention strategy that works.
If you’re looking for more information on how to track and analyze your product’s attrition and retention rates, we can help. The Mastering Retention Playbook is a step-by-step guide that takes you through the process of setting up retention goals, prioritizing experiments, and tracking your progress over time.
References
- Is your churn rate within a healthy range?, Recurly Research
- The ultimate OKR guide, Perdoo
- 10 Customer Retention Metrics & How to Measure Them, Oren Smith for HubSpot
- 70 Powerful Customer Retention Statistics You Need to Know in 2021, Elizaveta Pavlovskaya for Semrush
- What is customer attrition?, BigCommerce


Brandon Khoo
Former Senior Product Manager, Amplitude
Brandon Khoo is a former Senior Product Manager at Amplitude, leading the strategy and development of the Amplitude's insights-driven customer data platform. His role also involves defining the integration infrastructure for Amplitude’s partner ecosystem. Brandon is an alumnus of Uber and KPMG, and he holds degrees in Electrical Engineering and Finance from the Queensland University of Technology.
More from Brandon


