How to Build a Retention Model
Managing Director at Permutable, Timothy Daniell, on building retention models and the three simple steps that represent 80% of retention work.


A few months back, Jorge Mazal, ex-CPO of Duolingo, hung out with community members in one of our monthly AMAs and chatted about building a growth model that measures current, new, and returning user retention rates. Duolingo used this model to find a growth vector that ultimately led to 4.5x in growth. This sparked a flurry of conversations in our Slack community around how to measure and build this same thing using Amplitude.
We’re excited to finally deliver a workshop that answers these questions, and it’s been worth the wait. A huge thank you to Timothy Daniell, Managing Director of Permutable - an analytics and experimentation agency. Timothy shared how he tackles these same retention questions, sharing best practices that he’s spent a great deal of time building and refining.
Key Highlights
To chat more with Timothy, you can find him by joining our Slack community or by connecting with him on LinkedIn.
And here's the link with all eight charts Timothy showed the group how to build.
Below is a detailed recap of Timothy’s workshop:
1. How do I chart retention so it measures valuable user engagement?
While you go about building your chart, here are a few things that I look out for in Amplitude, but these are general enough to apply whatever analytics platform you use:
- "Return On" vs "Return On or After": This is the difference between bounded and unbounded retention. From Day 0, we’re measuring how many people came back each day. Return on measures who came back exactly on that day. On the other hand, return on or after measures how many people came back on day N or after, and that data will change as time goes on. I prefer “return on,” it’s cleaner and you'll be able to compare your product better to other products
- Choose a meaningful starting event: Make your new user definition more meaningful by choosing an event that actually indicates someone signed up to use your product. In Amplitude, I usually change “New User” to something like “User Signup.” It also avoids double-counting users who engage in recurring events or showed up on the platform before you rolled out your current analytics tool.
- Choose a valuable return event: Opt for active events to identify meaningful engagement in your product. But be sure to mark passive events like push notifications as inactive events, since that’s not really a sign of the user getting value from your product.
I start with building a Day N retention chart to look at all of these things.
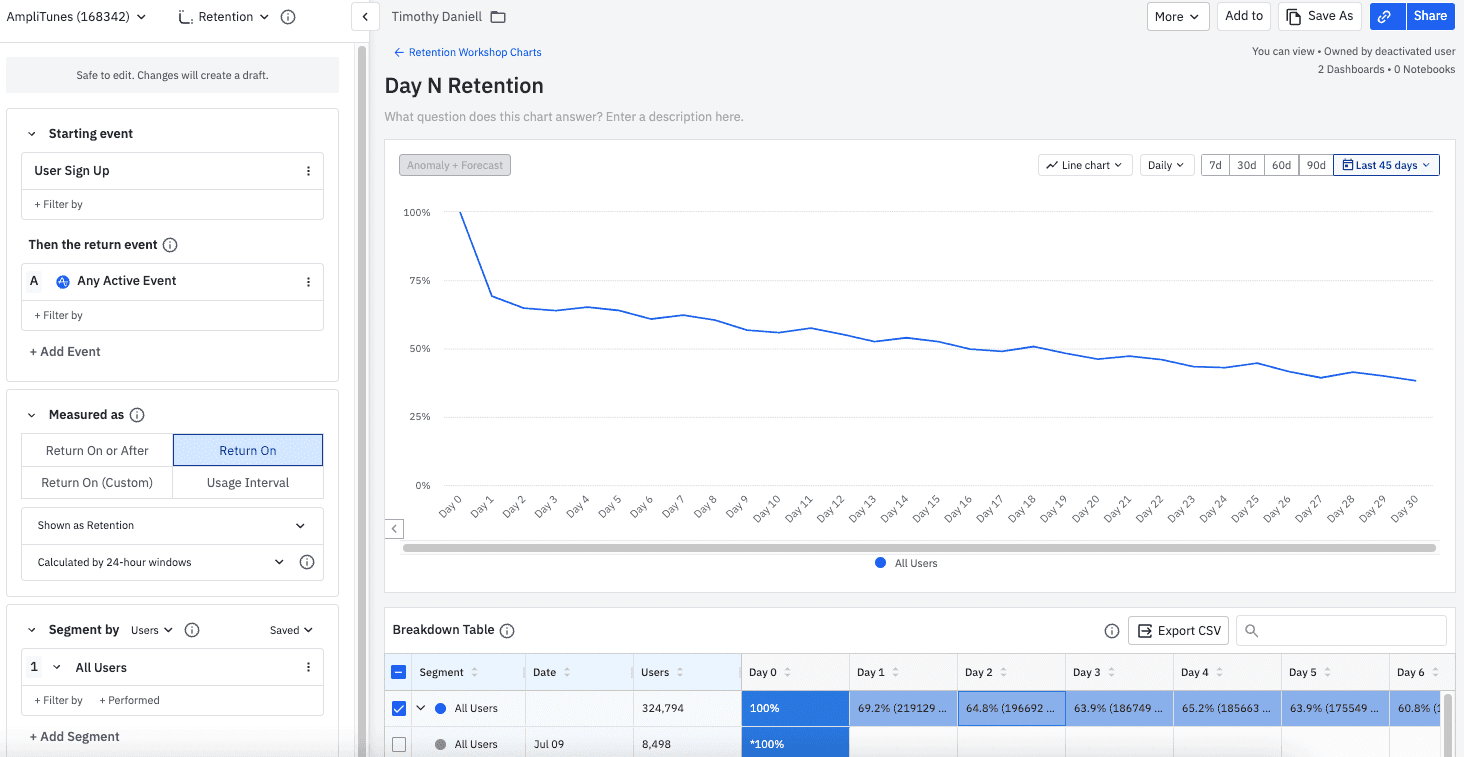
Day N Retention Chart
2. What do different shapes in the retention curve tell you about growth?
Now that you've had a chance to make a retention chart, you will have some sort of shape. Most people look at their charts and ask questions like, “Is my retention good? How does it compare to other products? And what matters more - day one or day 30 retention rates?”
All of these different questions will start to come up. And the place I'd like to start with retention is actually thinking about the shape of the line. So here's my crudely drawn drawings of the different kinds of shapes that you might see in your retention chart.
Retention curve patterns
- Blue - Begins as highest retention and goes down gradually without signs of stopping (will eventually get to zero) and although something is initially getting users back, it indicates you probably don’t have product-market fit.
- Yellow - Begins at highest retention and gradually levels out to 25% of users maintaining use of the product.
- Red - External triggers like marketing campaigns or push notifications or automation that goes out, which can temporarily get back a lot of users but then they go away again, which isn’t a sustainable pattern for retention. Although it is a good way to activate users in early days.
- Green - Flattens out quickly on Day 1. Indicates an opportunity for changing the audience that comes to the product (such as through marketing or activating users in a different way), and this could lead to a flattening out but at a much higher level on Day 1.
3. Can you give a single metric or KPI to encapsulate a product’s retention rate?
Honestly, my opinion is no, there's no one way to look at retention. Choosing the right retention metrics depends on whether you're focused on short-term or long-term retention.
- Short-term metrics like day one or day seven retention are often discussed, while less frequent apps may consider metrics like week 12 or six-month retention.
- Generally, it's important to optimize for long-term retention, although improving short-term retention can contribute to long-term success.
- Ultimately, there's no one-size-fits-all answer—it depends on your product. What are your priorities: short-term or long-term retention?
4. How does grouping by segments help improve product and marketing performance?
A good starting point to focus on for long-term retention can be built by just using the default chart setup from Amplitude. Switch the frequency to daily, weekly or monthly basis, depending on the frequency most relevant for your product. And then take the value farthest to the right to look for a rate to start optimizing for.
So we want to build our second chart, which is not that much more complicated, but hopefully starts to generate some more insights about our retention, which is grouping our retention chart by a dimension. We’ll take the case of grouping by country, which feels basic but is actually quite revealing when you start thinking about experiments you want to run.
- Group the retention chart by country: Utilize the "group segment by" feature to segment the retention chart based on different countries.
- Identify different shapes in retention curves: Analyze the differences in retention patterns among various countries. Look for countries with the highest and lowest retention rates.
- Understand why differences exist: For the countries with the highest retention curves, what factors might contribute to their success? Similarly, for countries with the lowest retention curves, why is engagement lower? Consider the following aspects:
- Product differentiation: What’s different about my product’s experiences between these two countries? Are there unique features or localization efforts that contribute to higher retention in certain regions?
- Marketing strategies: How is my marketing different in these countries?
Potential is a function of both product and marketing. In other words, the users that you attract, and what you do with them. I've seen a lot of products improve significantly by changing their marketing, rather than changing the product.
Timothy Daniell, Founder of Permutable
5. What are ways to benchmark your retention rates?
One of the things that teams struggle with most is understanding what their retention rate signifies. Is it good?
And even the best teams find this really difficult.
My starting point is maybe you shouldn't try to benchmark against others, but you should try to benchmark against the job which your product is trying to do. What do you think is the ceiling for your product, what percentage of your users do you think is realistic that they would come back on day N and use your product? Because very different products have very different potential in terms of retention.
I do, however, have a collection of retention benchmarks that I keep around, and I’m happy to share them here:
- Andrew Chen, General Partner at Andreesen Horowitz
- Priyanka Arora - DAU/MAU ratio benchmarks by industry
But as long as your retention is flattening, you're probably in quite a good place. Ultimately you just need a way to make money from the users that do end up sticking around and acquiring them at a reasonable cost.
Try to find references in your own base. When you segment your retention chart, take a look at your best segments and try to get the rest of the levels up to that best segment. Maybe that's the ceiling you should aim for instead of high-level benchmarks.
6. How can segmentation create sensitivity in your retention metrics?
Segmentation is the secret sauce of making retention actionable. Try to try to break it up into different chunks, because it makes it much more addressable.
There are two ways you can split up your user base:
- Who they are - attributes people have before they come to the product.
- What they do - represents events and actions in your product or marketing efforts, how they interact with your product.
User segmentation groupings
By carving up your retention chart by these things. And you can learn a lot about what the drivers are of retention.
- Typically who they are going to be a better indicator of retention and a more actionable indicator.
- When you try and analyze your retention based on what your users do, you're going to see a lot more correlation (but not causation).
For example, users who view help or consume lots of content are more likely to retain better, but it's probably going to be a correlation rather than causation. So it's not because they did those things, it's because they were higher intent users at the beginning.
Timothy Daniell, Permutable
Whereas if you look at something like an acquisition channel, it's quite likely that if you get more users from your best performing acquisition channel, then your retention will go up overall.
So even though we're all trying to improve our products, to improve retention, it might be that the simplest thing to do is to change the users that you acquire. And that's your starting point.
When you analyze retention over time and viewing different event activity, are users actually doing different things or are they just simply different kinds of users?
The key to segmentation is to ask good questions in your product, perhaps during the onboarding stage, or augment your data in a good way so that you can segment your users. Because that segmentation is then what drives insight
7. How do you measure how certain actions correlate with retention?
In Amplitude, you have a wonderful chart called Compass. It allows you to look at how often or what percentage of users do a particular action and how it correlates to retention or another metric. It’s probably my favorite chart in Amplitude.
It's also really good if you want to analyze conversion, a lot of the same techniques apply for conversion and retention. Once you get into it, you can really find some interesting patterns. And that’s where I go to do behavioral segmentation.
Amplitude Compass Chart to show how certain actions correlate to retention
8. How can you calculate and leverage the Daily Active Users to Monthly Active Users (DAU/MAU) ratio to measure and improve retention?
The DAU/MAU ratio is actually a retention metric since it measures how many of your monthly active users are in your product every day.
For example, if all of your monthly active users are active every day, then this chart will be at one every day. And that's a really good indicator for retention, because no one goes away. So you have perfect daily retention.
DAU/MAU Ratio Calculation
(If you're getting a 20-30% DAU/MAU ratio, that's great.)
If you want to calculate DAU/MAU in Amplitude, here’s how to go about it:
- Start with your chart in the daily view
- Use this formula in the formula tab: UNIQUES(A)/ROLLWIN(UNIQUES, A, 30) The numerator of the formula is simply the unique actives on a daily basis. The denominator is effectively your rolling view of your monthly active users.
9. How do I build the Duolingo Growth Model for my own product?
The Duolingo growth model is a way of breaking down your active users into different categories.
Users start off as new users at the top and then they become current users. Then the model shows all of the different user states.
- Current user - someone who keeps coming back
- At risk states - people who become somewhat dormant, in the Duolingo model, this is someone who doesn’t come back on Day 1
- Reactivated or resurrected - at risk users who become current users again
What this growth model is trying to answer is:
- How do active users split up into these different groups?
- How are the transitions between these groups?
- If we improve the transition between any one of these groups, where will we find the biggest growth opportunities?
If you’re using Amplitude or something similar, there are two ways you can build something similar:
- Simple: Use the Lifecycle Chart to identify new, current, resurrected, and dormant users.
- Complex: Build the Duolingo growth model following these steps. The steps are charted out in this Amplitude notebook.
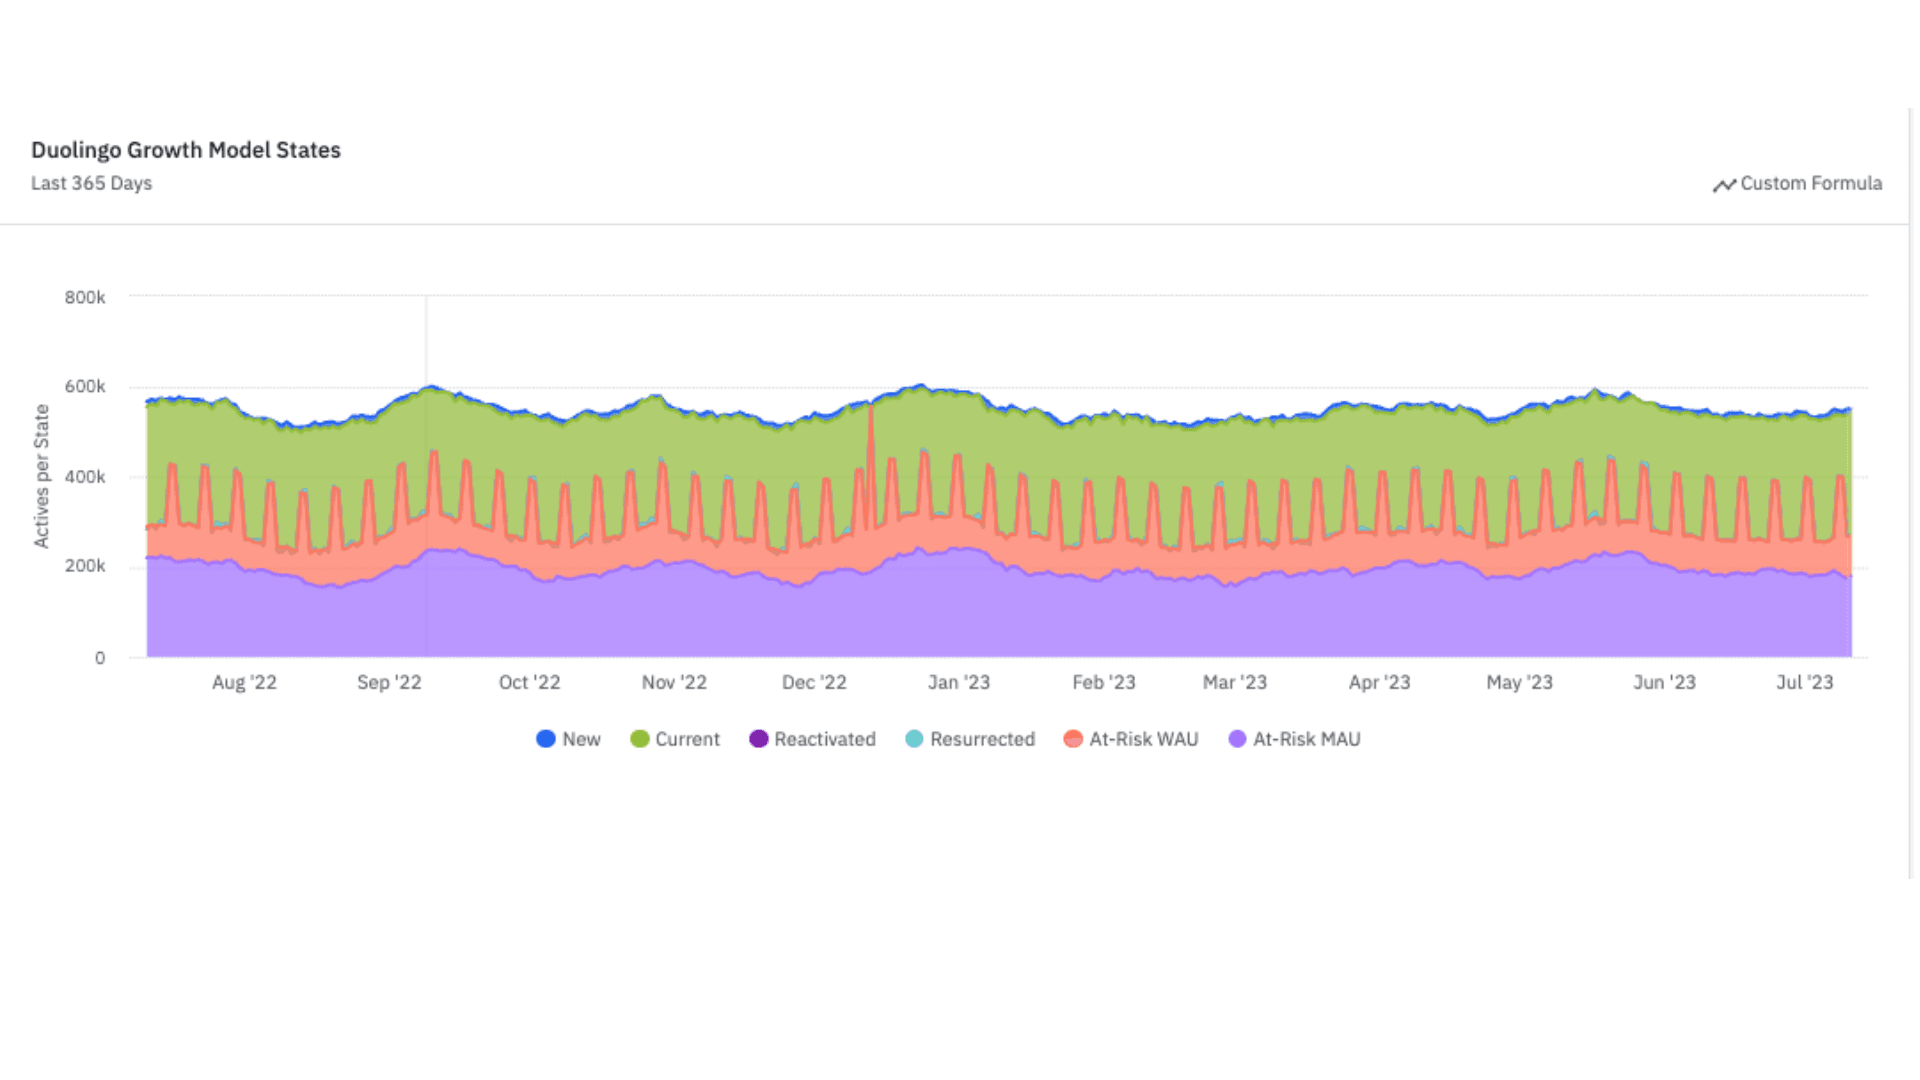
Duolingo Growth Model States using Amplitude Event Segmentation
10. What are the three things that teams should focus on to improve retention rates?
Once you start seeing insights, here are some patterns I’ve observed in the field to help improve retention:
- Try to acquire more users like your best performing segments - Get more users like your best performing users or less of the bad performing users
- Adapt your product per segment - Ask questions of users and adapt the product so that it’s different for each segment (example: getting started steps, change the tutorial, etc.)
- Improve your triggers - If you have a product where retention is hard, and you’re having to send a lot of emails/notifications, over time they’ll get fatigued with that constant contact. To improve, try to rework where you trigger or notify users so that they come from other users.
Join our community!
To get updates on upcoming events or connect with other data-informed peers, join our Cohort community Slack space or newsletter list!

Timothy Daniell
Founder, Permutable
Timothy Daniell is the founder of analytics and experimentation agency, Permutable. Timothy studied Mathematics at the University of Warwick, and afterwards joined the sports betting exchange Betfair to work on various probabilistic modelling challenges. Moving into product management, he was part of the team who released the market-defining "Cash Out" feature. At Berlin language learning startup Babbel, he built the payments platform and data science team.
More from Timothy


