Churn Rate Formula: How to Calculate and Analyze Churn
Learn how to define and calculate churn to improve customer retention.

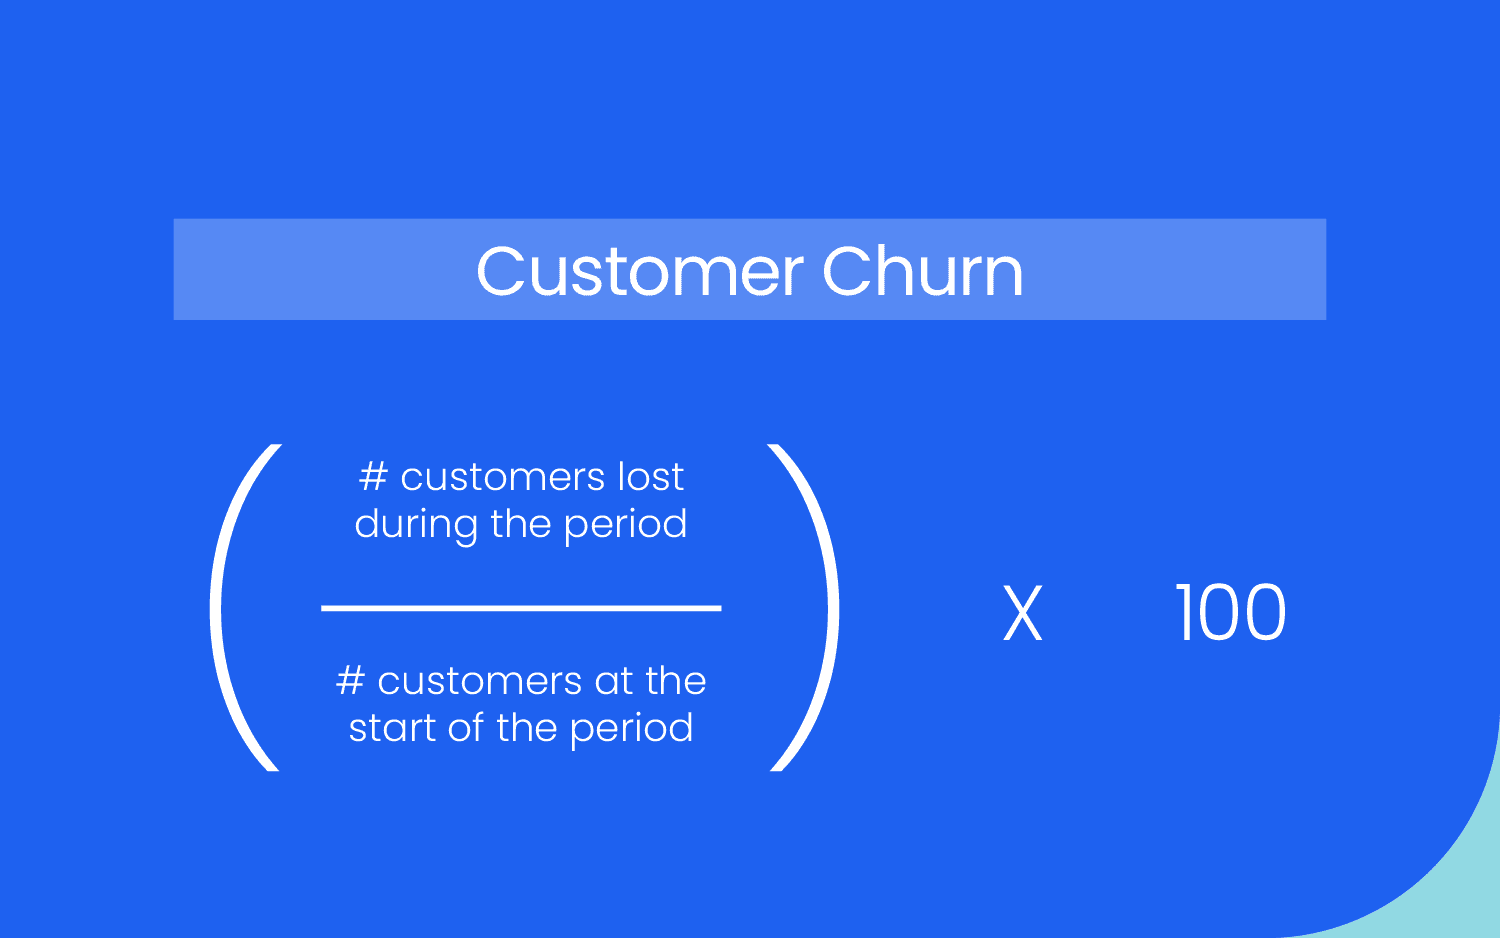
The formula for customer churn rate is (the number of customers lost during a period / the number of customers at the start of the period) x 100.
Organizations use the churn rate formula to calculate the number of customers lost over a specific period, providing insight into the organization’s health. Calculating your churn rate, or attrition rate, should be your starting point as you investigate, resolve, and reduce the causes of churn.
Key takeaways
- You can calculate different types of churn with the churn formula, like customer, revenue, and user churn.
- You should track churn continuously, but the specific frequency with which you analyze it depends on your organization.
- Once you’ve calculated your churn rate, analyze it further to determine the cause and develop retention strategies.
- Determine a sustainable or desirable churn rate for your product and business model rather than comparing or benchmarking externally.
What is churn rate?
Your churn rate indicates the revenue or customers lost over a certain period. Tracking your customer and revenue churn rate helps you optimize your product to improve customer satisfaction, increase retention, and boost profits.
Calculating churn starts with looking at the number of customers who stop using your product during a given period. Organizations measure churn over different periods—for instance, annually, quarterly, monthly, weekly, or even daily.
It’s essential to examine both revenue churn and customer churn. Customer-based churn tells you how many people dropped off and helps you assess user behavior with your product.
Revenue-based churn focuses on the impact of churn on revenue and helps you identify and retain the highest-value customers. In a subscription business model, some customers represent more revenue than others, depending on their subscription plan.
For example, if you experience a monthly customer churn of 5%, but more of those customers are premium-tier subscribers, the revenue loss is more significant than if the churn was amongst basic plan subscribers.
Basic churn rate formulas
The basic formula for customer churn is:
The basic formula for revenue churn is:
How to calculate churn rate (with examples)
To calculate churn, decide on the time frame you want to examine. Gather data on your customers and revenue for that period, then use both formulas for calculating customer and revenue churn rates.
The best period to examine depends on how often you expect people will naturally use your product—also known as your product usage interval. Let’s say you have a food delivery app where most people order once a week, on average. Analyzing daily churn won’t be helpful; examining weekly or monthly churn would be better.
In contrast, if you’ve designed your product for use several times a week—like a workout, social media, or productivity app—you’ll want to analyze daily churn.
You should analyze churn over several different timeframes for a complete picture. For instance, while the daily churn rate is essential for a workout app, looking at it monthly or quarterly will provide insight into longer-term trends.
Calculating customer churn
To calculate customer churn, determine how many customers lost during the period. Divide that by the number of customers you had at the start of the period, then multiply the result by 100 to get a percentage figure.
Example 1:
Your platform had 200 users at the beginning of January, and you lost 30 customers before the end of the month.
- 30/200 = 0.15
- 0.15 x 100 = 15
So, your churn rate for January is 15%.
Example 2:
You had 2,500 customers at the start of the year and lost 50 customers by the end.
- 50/1500 = 0.033
- 0.033 x 100 = 3.3
So, your annual churn rate is 3.3%.
Calculating revenue churn
Revenue churn uses the same formula but with revenue in place of the number of customers.
Example:
You had $10,000 in monthly recurring revenue (MRR) on May 1, but you lost two customers, each representing $500 monthly recurring revenue, before the end of the month.
- $500 + $500 = $1,000 MRR
- $1,000 / $10,000 = 0.1
- 0.1 x 100 = 10
So your monthly revenue churn rate is 10%
Streamline your churn calculations
While manual formulas work, there’s also an easier way to calculate churn: with Amplitude. Watch our senior solutions consultant, Darshil Gandhi, calculate your customer churn rate in six clicks.
When to measure churn
Your churn rate isn’t a one-and-done metric. Organizations should track it on an ongoing basis to measure the success of your product and company.
You should create routines around analyzing and responding to changes in churn. Whether you do this monthly or weekly depends on your organization’s pace and capacity to respond to changes.
Churn is such a critical metric for software-as-a-service (SaaS) companies. So, quickly identifying changes in churn is essential to remediate the cause before you lose more customers.
Evaluating churn for an isolated moment is not particularly useful, but analyzing and monitoring churn rates over time enables internal comparison.
For example, knowing that your churn rate in March was 3% is not helpful. However, knowing that it was 1% in January and February and increased in March alerts you of a potential issue to investigate further. Similarly, if churn was high in February but dropped in March, it might suggest that the churn-combating product upgrades you shipped are working.
How to analyze churn rate
Once you know the churn rate for a specific period, conduct cohort analysis to develop and test theories about the causes and implement solutions.
Start by figuring out the churn rate, whether daily, weekly, or monthly. You should use time-based cohorts—for instance, 2% of customers who joined on the first day of the month churned by the end of the month.
Then, break the time cohort down further to compare churn rates for different demographics, acquisition channels, or behavioral cohorts. For example, analyze behavioral cohorts that include people who activated notifications on the first day vs. those who didn’t.
Theorize why the churn rate varies across cohorts, and look out for cohorts where churn is higher than average. Identify the moment churn spikes for a particular cohort to identify potential friction points you need to solve in your customer journey. Using our behavioral cohort example, you might discover that those who don’t activate notifications tend to churn more than those who do.
You should then develop hypotheses and prove or disprove them with A/B testing. Let’s say you hypothesize that customers who activate notifications within the first day retain better. You could test this by prompting users to activate notifications or by configuring the app to activate them by default. You might find these prompts help to reduce churn, in which case you should roll out the change.
What is a good churn rate?
Your organization’s churn rate benchmark depends on your industry, business model, product type, and other factors. Ultimately, the difference between a sustainable and dangerous churn rate is the revenue each percentage point represents.
You want to keep churn as low as possible because you don’t want to lose customers you’ve worked hard to acquire. But it’s normal to have some level of churn, as you can balance the loss by acquiring new customers or increasing the value of retained customers.
There are various churn rate benchmarks found online for SaaS businesses. Many growth experts advocate for a 5% annual churn rate benchmark, but studies indicate a wide variety in churn rates across SaaS companies.
Your churn rate is a moving target as it varies based on different factors. Antenna analyzed the churn rate of subscription streaming services and found that Netflix’s churn rate was less than 2% during the pandemic but was almost 3.5% in 2022.
Before you compare your organization’s churn rate to that of other organizations, you should account for:
- Time period: You can’t compare your monthly churn rate to another company’s annual churn. External events, like Covid lockdowns or high inflation rates, will also impact churn rates during different periods.
- Industry: A mass-market product can expect higher churn than a niche product.
- Business model: Your target segment, product type, and amount of revenue each customer generates will affect the sustainability of your churn rate.
Determine a sustainable or desirable churn rate for your organization. Instead of focusing on external comparisons, compare your customer and revenue churn to determine the impact customer churn has on revenue. Project the long-term impact of your current churn rate and what would happen if it increases or decreases.
You should also consider other factors besides churn rate to better understand your business's health. For example:
- The value of retained customers.
- The number of customers acquired during the same period you’re evaluating churn.
- Your customer acquisition cost.
- The average customer lifetime value.
Calculate and optimize your churn rate with Amplitude
Your customer and revenue churn rates provide invaluable insight into your product, user experience, and business health. By regularly calculating, tracking, and analyzing your churn, you can identify the predictors of churn and optimize your product and marketing strategies to reduce customer loss and increase retention. And while you can calculate these manually, leading customer analytics software, like Amplitude Analytics, help you do so with just a few clicks.
See for yourself with Amplitude’s self-service demo today.

Pragnya Paramita
Former Group Product Marketing Manager, Amplitude
Pragnya is a former Group Product Marketing Manager at Amplitude. She led the go-to-market efforts for data management products. A graduate of Duke University's Fuqua School of Business, she is passionate about working at the intersection of business and technology and when time allows, cooking up a storm with cuisines from all over the world.
More from Pragnya


