Step-by-Step Guide to Cohort Analysis & Reducing Churn Rate
Follow our step-by-step guide to conduct a cohort analysis that will help you reduce churn.

Originally published on July 15, 2022
Browse by Category
Churn rate cohort analysis is a type of analysis that calculates and gives you the information you need to increase user retention. You’re able to analyze user life cycles and identify when users churn or stop using your product. From there, you can learn about your users’ behavior and investigate the reasons that lead to churn. Once you understand why users churn, you’re ready to take action to reduce the rate of churn and keep people engaged with your product.
Customer churn analysis: Key takeaways
- To conduct a cohort analysis to reduce churn, start by grouping users based on when they joined your platform.
- Next, identify at which points in the customer lifecycle users churn.
- Then analyze other types of cohorts to investigate churn further.
- Develop hypotheses for why users are churning.
- Finally, test out your hypotheses and roll out product adjustments to reduce churn.
Understanding the relationship between churn rate & cohort analysis
Most companies see a small percentage of churn as healthy and normal. But a large number of users leaving your product is a cause for concern. Cohort analysis helps you reduce churn rates because it allows you to investigate why groups or segments (cohorts) of users leave your app. If you can figure out what’s making people leave, you can take action to avoid high customer churn rates.
Cohort analysis also lets you understand which factors lead to high engagement and customer retention. If you focus on retention and providing value to existing customers, you’ll often get a higher ROI than if you focus purely on customer acquisition. You’ve already invested time, money, and effort into acquiring customers, so it makes sense to try and keep them on your platform instead of only focusing on reaching new users.
5-step guide to completing a cohort analysis that reduces churn
These steps show you how to conduct a cohort analysis that will help you identify when and why your users are leaving, so you can experiment with solutions to reduce churn.
1. Group users based on when they joined your app
Start your analysis by grouping users based on when they joined your app. “Date joined” is a type of acquisition cohort—you’ll use behavioral cohorts later in your analysis. Rather than looking at churn rates across all users, this will let you see when users churn in relation to the customer lifecycle.
Create daily, weekly, or monthly cohorts, depending on your type of app and your product usage interval. For example, if you run a meditation or fitness app, it’ll be useful to look at daily acquisition and usage. If it’s an app people might use less frequently (like an investing app), you’ll probably use monthly or weekly cohorts.
The time frame you include in your analysis will also depend on what you want to find out. You’ll look at daily retention or churn over the course of a few weeks to see short-term changes. To spot longer-term trends, you’ll look at the monthly retention rate over the course of a year.
When you’ve established the cohort you want to analyze, create a cohort table in Excel or use analytics software like Amplitude. In a cohort table, there are rows for each cohort and columns for each day, week, or month. “Day zero” is the day that the user joined the platform. In the cells, display either the churn rate or the retention rate.
If you were tracking cohorts by day, your “joined July 11” cohort might show a retention rate of 100% in the day zero column, 10.8% in the day one column, and 4.87% in the day two column. Try exploring this data for free by using Amplitude’s self-service demo, then navigating to this example cohort table.
2. Identify when users in each cohort churned
If you can identify the point at which users churn, you can spot patterns in the user journey. You’ll be able to investigate further to discover why they churn at that moment.
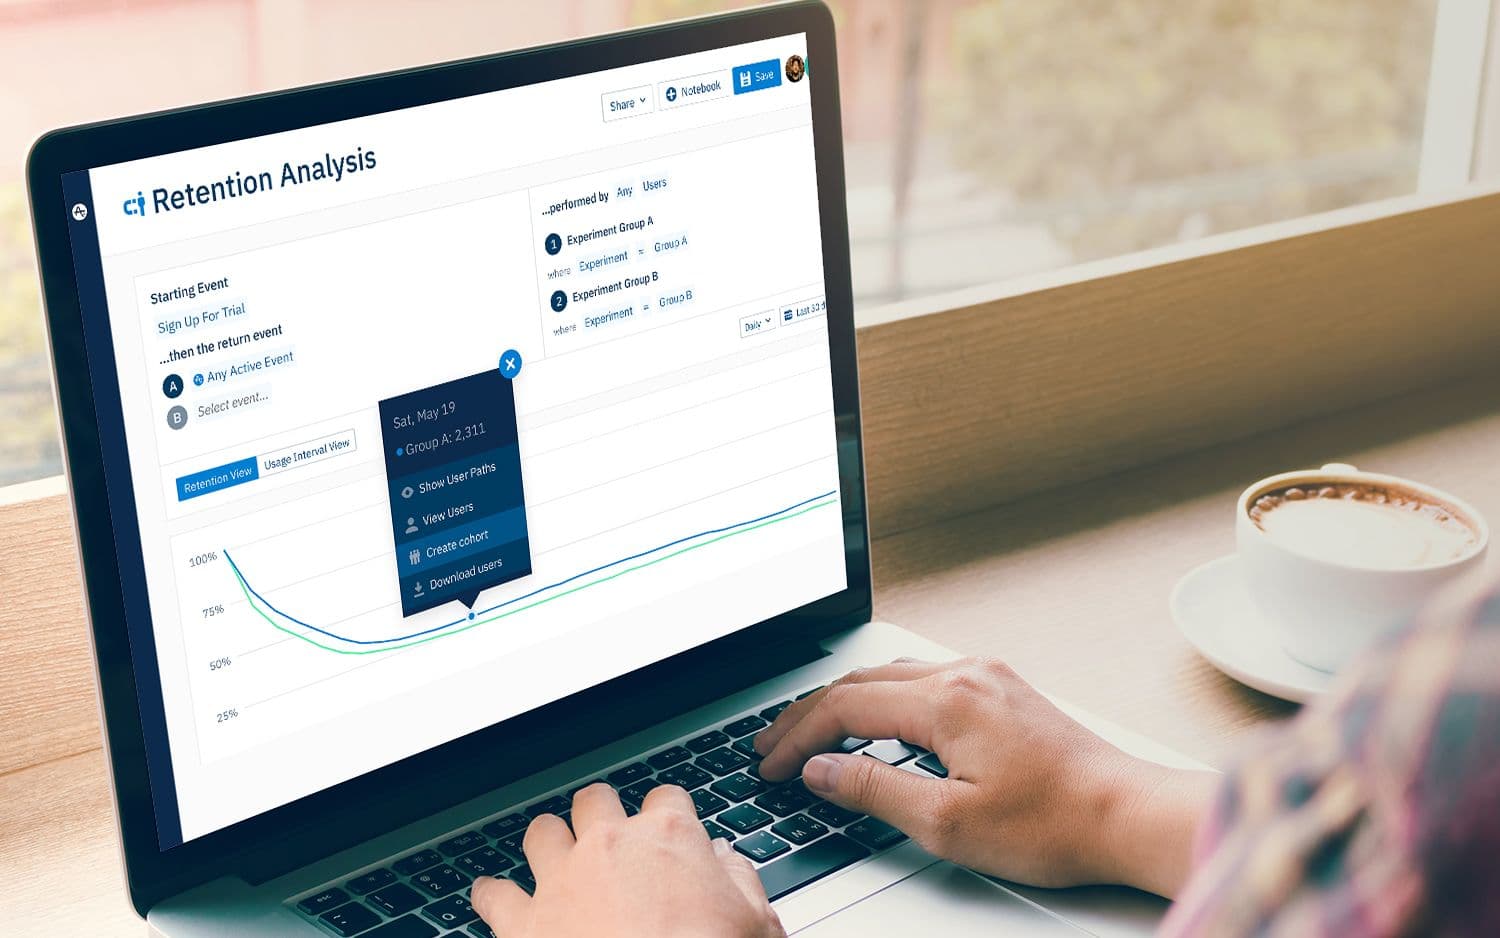
Take a look at your cohort analysis chart and find points when many users churn. To visualize the retention curve and easily spot when people drop off, convert your cohort table into a chart.
When you set up a Retention Analysis chart in Amplitude, you can select “Retention View” to see a graph of the retention curve. Try it yourself using Amplitude’s self-service demo.
Oftentimes, product and growth teams will make a list of “problem” moments—points in the user lifecycle when users leave, for example, after 10 days or after the first month.
3. Analyze other cohort types to investigate churn further
After you’ve looked at churn in relation to the acquisition date, creating groups of users based on their behaviors, acquisition channels, or demographics will help you understand them further. It brings you one step closer to discovering the reasons why users leave.
Use behavioral cohorts to group users by actions they have or haven’t taken. You might look at users who read reviews before purchasing or those who make an in-app purchase within the first three days of joining the platform. In each case, you’ll want to compare the cohort who does take the action with those who don’t to see if there are any links to churn.
In addition to using behavioral cohorts, group users by type of acquisition to identify which channels lead to churn and when. For example, you might notice that users from paid ads churn faster than those who convert from your newsletter. Another way of segmenting users is by demographics—look for patterns among different age groups or locations.
For consistency, look at different cohort types in the same time frame as the acquisition cohort analysis you did. Investigate one customer cohort at a time, so you can clearly see which factors are contributing to churn. You’ll start to draw conclusions about why cohorts vary in the next step.
4. Hypothesize why churn happened for each cohort
Now that you’ve gathered data on different cohorts, you can theorize about why people are churning. By building and testing out hypotheses, you can discover what’s really causing churn.
Based on the “problem moments” you spotted from your investigation into when people churn, along with your analysis of the different behavioral cohorts, pick out the cohorts with the highest churn rates. Then brainstorm what could be causing churn.
For example, from the acquisition date cohorts:
- Seasonal changes impact app usage—a lot of users joined during the holidays, but they churn in February because they don’t have enough free time to use the app.
- Users drop off after two days because the onboarding process is too long and complicated.
From the behavioral cohorts:
- Users who sign up for the “basic” plan churn because they don’t have access to enough features.
- Users who don’t activate reminder notifications end up churning because they forget to use the app and don’t get value from it.
From the acquisition channel cohorts:
- Users who sign up from the Instagram ad churn quickly because the ad doesn’t accurately portray the product, so there’s a discord between customer expectations and the product.
5. Test your hypotheses and experiment with solutions
Before implementing any product changes, you’ll need to check whether your hypotheses are correct. Be prepared for the fact that many different factors contribute to churn, so this stage will involve some experimentation.
First, check your hypotheses by conducting A/B testing. To test out your example hypotheses, you could:
- Simplify your onboarding process.
- Add more features to your “basic” subscription tier.
- Update your marketing campaigns to set more accurate customer expectations.
Experiment with different solutions to optimize your platform. For example, simplifying the onboarding process might stop users from dropping off after two days, but another solution could be to give users the option to skip onboarding altogether. If the adjustments you make reduce churn, you’re ready to roll them out to your whole app. If none of your hypotheses are correct or none of your solutions work, go back a step and continue your cohort churn analysis.
Continue your customer churn analysis
Cohort analysis is a process you will go through more than once. Customer churn rates change over time, so keep tracking cohorts and regularly conducting cohort analysis to spot patterns in user behavior—that way, you can take action to keep your customer retention rates high.
Try conducting your own churn rate cohort analysis today using Amplitude’s free starter plan, or check out our Mastering Retention playbook to learn more about fixing a leaky bucket.
References
- Churn Rate. Investopedia.
- Customer Acquisition VS. Retention: Where are Your Dollars Best Spent? ProfitWell.
- The 10 best user onboarding examples to learn from. Appcues.


Patrick Hammond
Former Senior Solutions Consultant, Amplitude
Patrick Hammond is a solution consultant and product specialist with over 12 years of business intelligence and product analytics experience. His passion is helping customers solve business challenges with data insights. He was formerly senior solutions consultant at Amplitude.
More from Patrick


